Cluster Sizing Case Study – Mirrored Queues Part 2
In the last post we started a sizing analysis of our workload using mirrored queues. We focused on the happy scenario that consumers are keeping up meaning that there are no queue backlogs and all brokers in the cluster are operating normally. By running a series of benchmarks modelling our workload at different intensities we identified the top 5 cluster size and storage volume combinations in terms of cost per 1000 msg/s per month.
- Cluster: 5 nodes, 8 vCPUs, gp2 SDD. Cost: $58
- Cluster: 7 nodes, 8 vCPUs, gp2 SDD. Cost: $81
- Cluster: 5 nodes, 8 vCPUs, st1 HDD. Cost: $93
- Cluster: 5 nodes, 16 vCPUs, gp2 SDD. Cost: $98
- Cluster: 9 nodes, 8 vCPUs, gp2 SDD. Cost: $104
There are more tests to run to ensure these clusters can handle things like brokers failing and large backlogs accumulating during things like outages or system slowdowns.
Adverse Conditions - Coping with rolling restarts and lost brokers
Will our gp2 SSD based clusters handle the same load if a broker goes down? Perhaps a VM or a disk fails, or you need to perform an emergency OS patch? We really need to make sure that on our Black Friday sales peak, that we’re going to be able to serve traffic even in the face of failures.
To that end, we run exactly the same test again, but hard kill a broker part way into each intensity level.
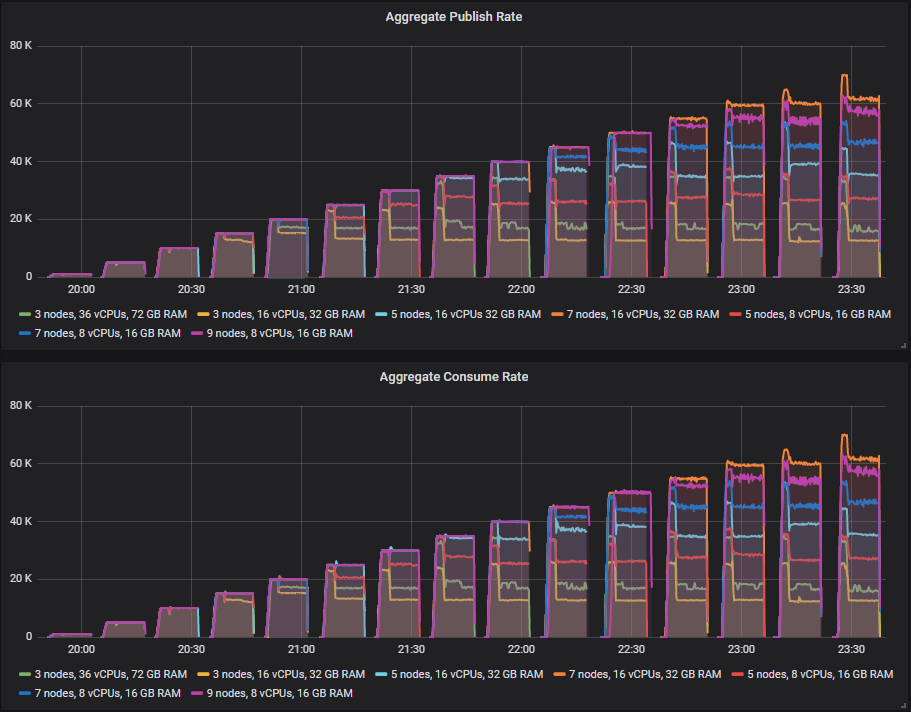
Some clusters did better than others but no cluster gets to the end of the test without seeing a drop in throughput when a broker is killed. The smaller 3 and 5 broker clusters see that drop in the lower intensity tests whereas the 7 and 9 broker clusters only start seeing that drop in the higher intensities.
Let’s look at our 30k msg/s target rate period.
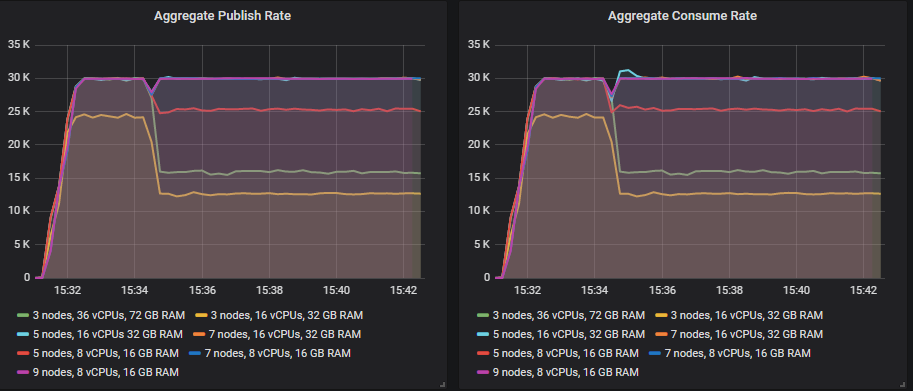
You’ll notice that the 5x16, 7x16, 7x8 and 9x8 clusters fully recover, while at the other end of the spectrum the 3 node clusters see the biggest dip. For the ones that fully recover, the dip is small but this is with ha-sync-mode as manual. If you choose automatic, the recovery still happens but the dip is larger and longer duration.
The reason for this drop in throughput is that when a mirrored queue becomes under-replicated because of a broker loss it will create a new mirror on another broker if it can - maintaining the same redundancy level. This concentrates the same amount of traffic on fewer brokers. So if you use a replication factor of 2 (one master, one mirror) like in this test, have three brokers and lose one then you’ll be increasing load on the other two by a sizeable percentage. If you use* ha-mode=all*, then you won’t see such a dip as there will be no brokers to place new mirrors on.
However if you have nine nodes and lose one, then the load increase is marginal.
Scaling out wins this round.
Adverse Conditions - Consumer Slowdown
When processing messages, consumers normally need to interact with other systems like databases or third party APIs. These downstream systems can slowdown due heavy load, or some kind of outage and this has the knock-on effect of slowing down your consumers. This then causes the number of messages in your queues to grow which can then also impact publishers. RabbitMQ delivers best performance when queues are small or empty (empty because messages are immediately consumed).
Our requirements dictated that if we suffer a consumer slowdown, the publishing should continue unaffected, even at the target peak load of 30k msg/s.
In this test the processing time per message varies:
- 5 minutes at 10ms
- Grows from 10ms to 30ms over a 20 minute period
- 5 minutes at 30ms
- Reduces from 30ms to 10ms over a 20 minute period
- 50 minutes at 10ms
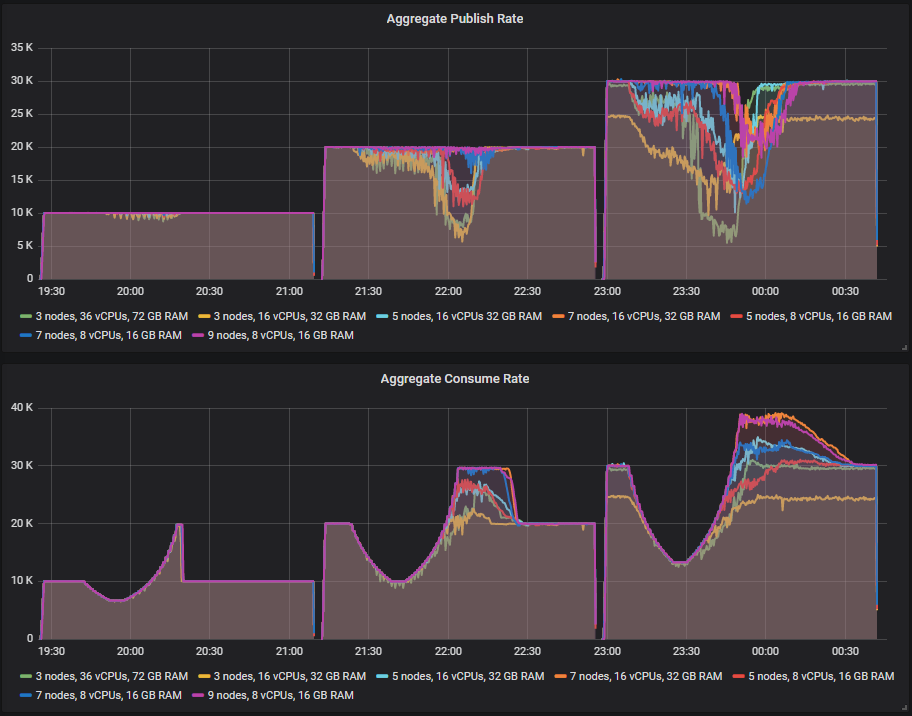
The message backlogs can grow into the tens of millions as this is a high traffic system where backlogs can form fast. We shall see an S shape to the consume rate as first the processing time increases, then decreases and consume rate then exceeds the publish rate as the consumers process the backlog.
As the consume rate recovers but the queue length is still very large, this is when we might see impact on the publishers. The publish rate can drop for a period until the backlog is cleared. The higher performing clusters should see no impact or an impact for a short duration.
We'll run the test at three different publish rates:
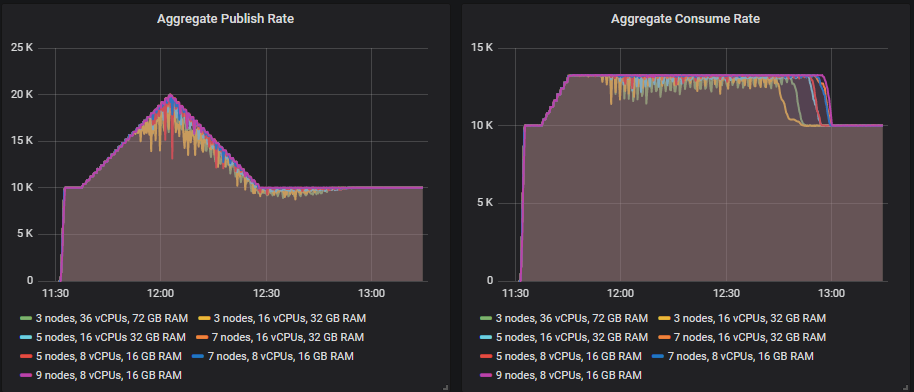
- 10k msg/s with 200 consumers across the 100 queues. Top consume rate is 20k msg/s which then drops to 6.6k msg/s at the 30ms processing time.
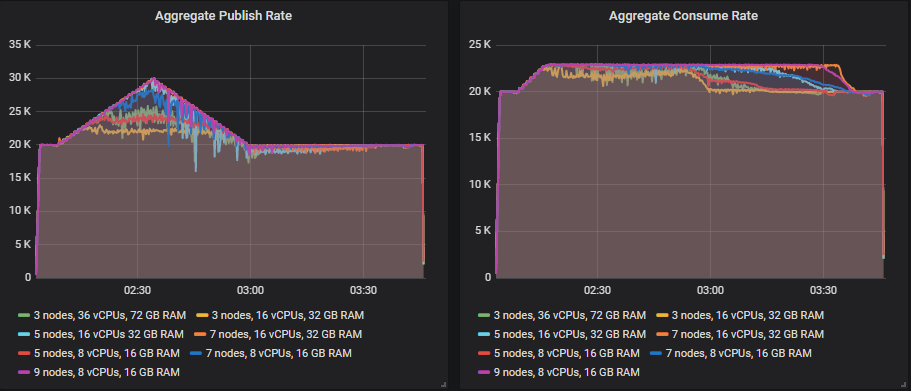
- 20k msg/s with 300 consumers across the 100 queues. Top consume rate is 30k msg/s which then drops to 10k msg/s at the 30ms processing time.
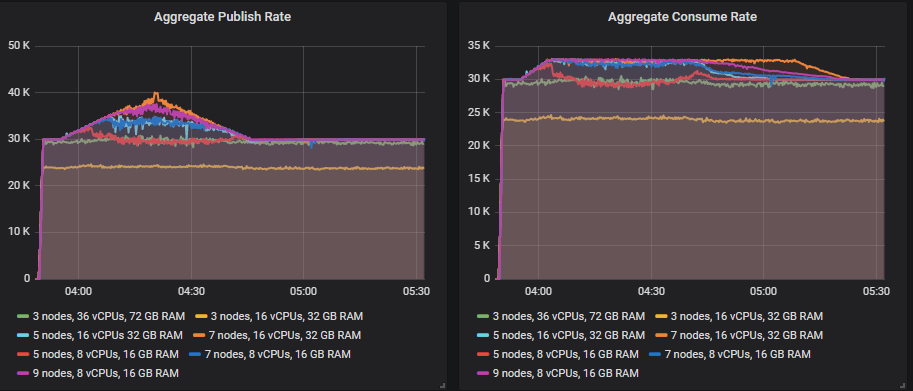
- 30k msg/s with 400 consumers across the 100 queues. Top consume rate is 40k msg/s which then drops to 13.3k msg/s at the 30ms processing time.
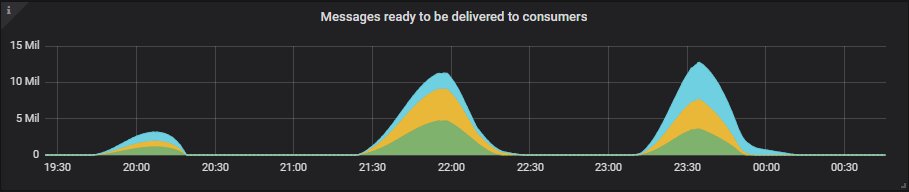
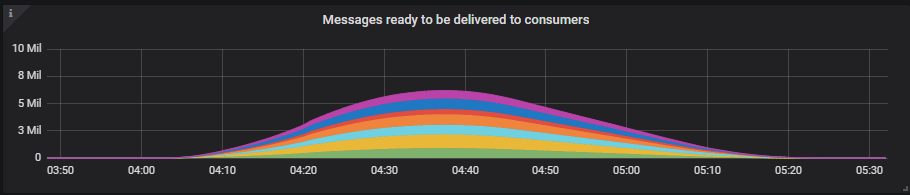
See some examples of how large the queue backlogs became.
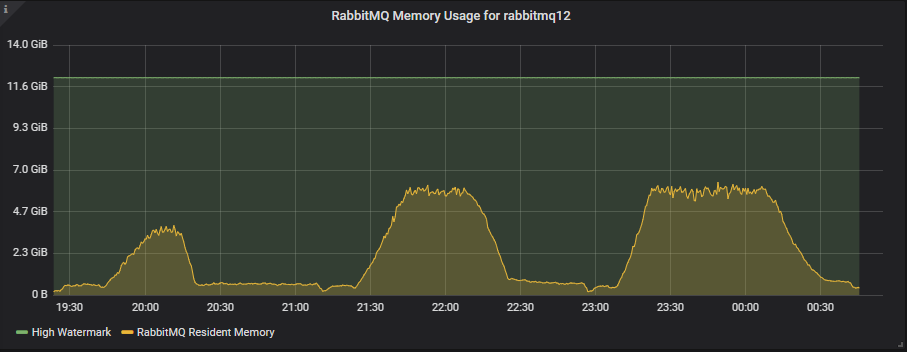
3x16 Cluster
7x16 Cluster
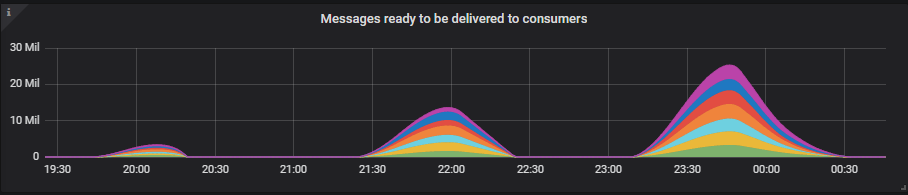
The queue backlogs grow quite large, but even so, we only reach up to 50% of our maximum memory limit of 11GB. We're using the default memory high watermark of 40% of server memory.
9x8 Cluster
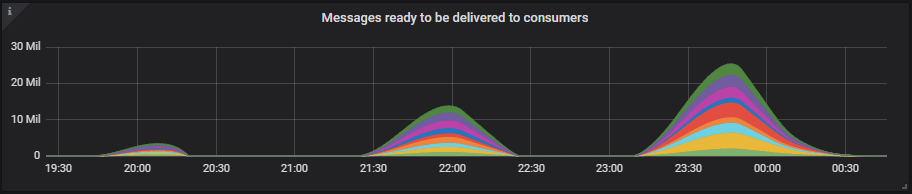
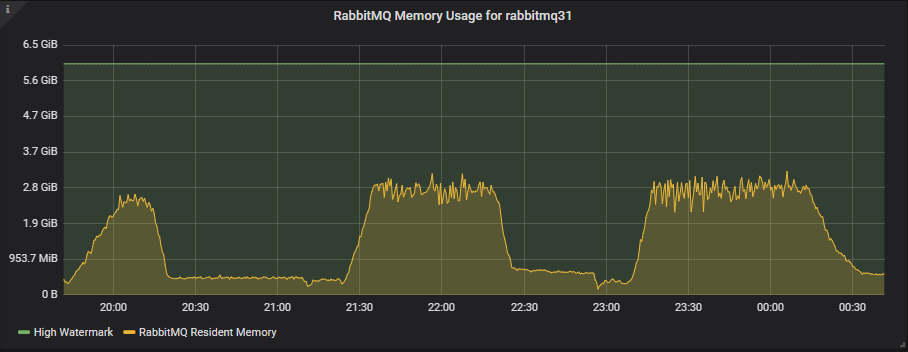
The smaller 8 vCPU instances have half the memory available with the high watermark at 6GB, but still these tests only use about half of that.
At 10k msg/s, all clusters handle the consumer slowdown and associated backlogs.
At 20k msg/s only the 7x16 and 9x8 clusters handle it without the publish rate dropping. The 7x8 is very close to handling it. The rest see a drop in publish rate as there is contention between consumers and publishers while the queue backlog is still high. Long queues are less efficient, both due to increase disk usage but also in-memory data structures. Note that this is our expected peak load, but we want to size for above that just in case (at 30k msg/s).
But at 30k msg/s none of our clusters were able to handle 30k msg/s sustained throughout the consumer slowdown. The best were the 7x16 and 9x8 clusters that had a reduced publish rate for around 20-25 minutes.
So either we decide that this is good enough or we need to go even bigger with either a 9x16 or an 11x8 cluster.
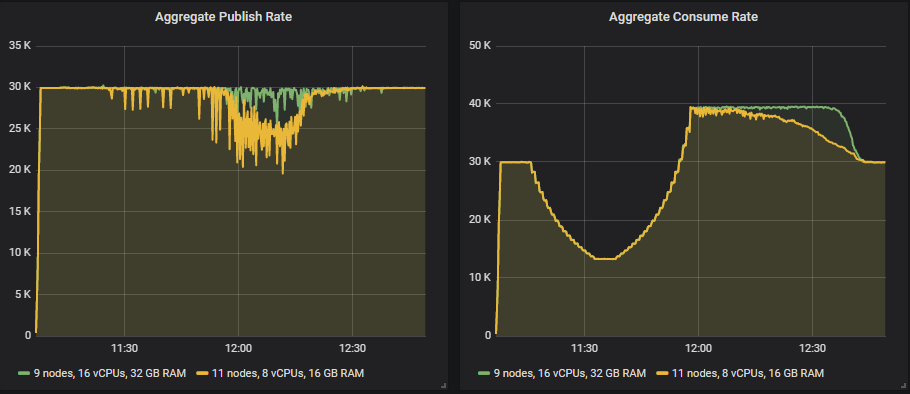
The 9x16 cluster handles the 30k msg/s load though with a slightly choppy publish rate. For the 8 vCPU instances, it looks like we would need to go up to 13 instances or more instances. These are large clusters, but this is also a very demanding workload.
You can run a test like with PerfTest (from version 2.12 and up):
bin/runjava com.rabbitmq.perf.PerfTest \
-H amqp://guest:guest@10.0.0.1:5672/%2f,amqp://guest:guest@10.0.0.2:5672/%2f,amqp://guest:guest@10.0.0.3:5672/%2f \
-z 1800 \
-f persistent \
-q 1000 \
-c 1000 \
-ct -1 \
--rate 100 \
--size 1024 \
--queue-pattern 'perf-test-%d' \
--queue-pattern-from 1 \
--queue-pattern-to 100 \
--producers 200 \
--consumers 200 \
--producer-random-start-delay 30 \
-vl 10000:300 \
-vl 11000:60 -vl 12000:60 -vl 13000:60 -vl 14000:60 -vl 15000:60 -vl 16000:60 -vl 17000:60 -vl 18000:60 -vl 19000:60 \
-vl 20000:60 -vl 21000:60 -vl 22000:60 -vl 23000:60 -vl 24000:60 -vl 25000:60 -vl 26000:60 -vl 27000:60 -vl 28000:60 -vl 29000:60 \
-vl 30000:300 \
-vl 29000:60 -vl 28000:60 -vl 27000:60 -vl 26000:60 -vl 25000:60 -vl 24000:60 -vl 23000:60 -vl 22000:60 -vl 21000:60 -vl 20000:60 \
-vl 19000:60 -vl 18000:60 -vl 17000:60 -vl 16000:60 -vl 15000:60 -vl 14000:60 -vl 13000:60 -vl 12000:60 -vl 11000:60 -vl 10000:60 \
-vl 10000:3000
Adverse Conditions - Publish Rate Peak Exceeds Consumer Capacity
Like the consumer slowdown, we end up with a situation where the publish rate exceeds the consume rate causing message backlogs. But this time caused by a large peak in the publish rate, one that our backend systems are unable to handle. Absorbing peaks in the publish rate is one of the reasons to choose a message queue. You don't need to scale-out your backend systems to handle peak load, which might be expensive, instead you allow the message queue to absorb the extra traffic instead. Then you process the backlog over a time period.
In this test we keep the processing time at 10ms but increase the publish rate then decrease it:
- 5 minutes at base rate
- Grows from base rate to peak over a 20 minute period
- 5 minutes at peak.
- Reduces from peak to base rate over a 20 minute period
- 50 minutes at base
We'll run three tests:
- 10 k msg/s base publish rate, 20k msg/s peak. 200 consumers with 13k msg/s top consume rate.
- 20 k msg/s base publish rate, 30k msg/s peak. 300 consumers with 23k msg/s top consume rate.
- 30 k msg/s base publish rate, 40k msg/s peak. 400 consumers with 33k msg/s top consume rate.
The 7x16, 9x8, 7x8 clusters handle the peak, with the 5x8 mostly handling it with a couple of momentary drops in publish rate. The other clusters got close but were not able to handle the target rate.
Only the 7x16 and 9x8 clusters could handle it, but the 5 node clusters were close.
Only the 7x16 cluster reached the 40k msg/s publish rate but the 9x8 was close. The 7x16 saw its message backlog reach close to 7 million messages but it still handled it.
You can run a test like with PerfTest:
bin/runjava com.rabbitmq.perf.PerfTest \
-H amqp://guest:guest@10.0.0.1:5672/%2f,amqp://guest:guest@10.0.0.2:5672/%2f,amqp://guest:guest@10.0.0.3:5672/%2f \
-z 1800 \
-f persistent \
-q 1000 \
-ct -1 \
-c 1000 \
--size 1024 \
--queue-pattern 'perf-test-%d' \
--queue-pattern-from 1 \
--queue-pattern-to 100 \
--producers 200 \
--consumers 200 \
--producer-random-start-delay 30 \
--consumer-latency 10000 \
-vr 100:300 \
-vr 102:60 -vr 104:60 -vr 106:60 -vr 108:60 -vr 110:60 -vr 112:60 -vr 114:60 -vr 116:60 -vr 118:60 -vr 120:60 \
-vr 122:60 -vr 124:60 -vr 126:60 -vr 128:60 -vr 130:60 -vr 132:60 -vr 134:60 -vr 136:60 -vr 138:60 -vr 140:60 \
-vr 142:60 -vr 144:60 -vr 146:60 -vr 148:60 -vr 150:60 \
-vr 148:60 -vr 146:60 -vr 144:60 -vr 142:60 -vr 140:60 -vr 138:60 -vr 136:60 -vr 134:60 -vr 132:60 -vr 130:60 \
-vr 128:60 -vr 126:60 -vr 124:60 -vr 122:60 -vr 120:60 -vr 118:60 -vr 116:60 -vr 114:60 -vr 112:60 -vr 110:60 \
-vr 108:60 -vr 106:60 -vr 104:60 -vr 102:60 -vr 100:60 \
-vr 100:3000
Adverse Conditions Test Conclusions
After performing the happy scenario tests, we had many clusters that could handle the peak load so we ended up a top 5 leaderboard of clusters in terms of cost per 1000 msgs/s per month. Now after running the adverse conditions tests we're down to two potentials from the original set:
- Cluster: 7 nodes, 16 vCPUs, gp2 SSD. Cost: $104 per 1000 msg/s
- Cluster: 9 nodes, 8 vCPUs, gp2 SDD. Cost: $81 per 1000 msg/s
Scaling out the smaller VMs gave us the best top throughput and cost effectiveness in the happy scenario. But the 7x16 was the best all-rounder when taking into account the resiliency tests.
Of course even the 7x16 cluster struggled with the 30k msg/s consumer slowdown test. So we might still need to consider the clusters:
- Cluster: 9 nodes, 16 vCPUs, gp2 SSD. Cost: $133 per 1000 msg/s
- Cluster: 11 nodes, 8 vCPUs, gp2 SSD. Cost: $99 per 1000 msg/s
Mirrored queue case study takeaways
Beware of only testing simple scenarios like our first happy scenario test where the publish rate is constant and the consume rate is fixed - you are only sizing RabbitMQ in ideal conditions. If you need RabbitMQ to deliver a certain throughput, even in the face of adversity then you need to include tests like the ones we've run in this post. You are more likely to see adverse scenarios when under heavier loads. Queue backlogs caused by slow consumers are more likely to occur when the wider system is under heavy load. Likewise, it can be peaks in traffic that causes the publish rate to exceed the consume rate. So testing at and beyond peak conditions is important to ensure that a cluster is resilient to your expected load.
The bottom line is that RabbitMQ can handle broker loss pretty well, what it struggles with more are queue backlogs. Our top clusters, the 7x16 and 9x8 configurations hit 65-70k msg/s in ideal conditions but only 20k msg/s in the most adverse conditions we threw at it. I say only 20k msg/s, but that is 1.7 billion daily messages which is higher than most use cases for RabbitMQ.
Finally...this was a specific workload, check out the other recommendations in the first post that can apply to other workloads and scenarios.