Cluster Sizing Case Study – Quorum Queues Part 1
In a first post in this sizing series we covered the workload, the tests, and the cluster and storage volume configurations on AWS ec2. In this post we’ll run a sizing analysis with quorum queues. We also ran a sizing analysis on mirrored queues.
In this post we'll run the increasing intensity tests that will measure our candidate cluster sizes at varying publish rates, under ideal conditions. In the next post we'll run resiliency tests that measure whether our clusters can handle our target peak load under adverse conditions.
All quorum queues are declared with the following properties:
- x-quorum-initial-group-size=3 (replication factor)
- x-max-in-memory-length=0
The x-max-in-memory-length property forces the quorum queue to remove message bodies from memory as soon as it is safe to do. You can set it to a longer limit, this is the most aggressive - designed to avoid large memory growth at the cost of more disk reads when consumers do not keep up. Without this property message bodies are kept in memory at all times which can place memory growth to the point of memory alarms setting off which severely impacts the publish rate - something we want to avoid in this workload case study.
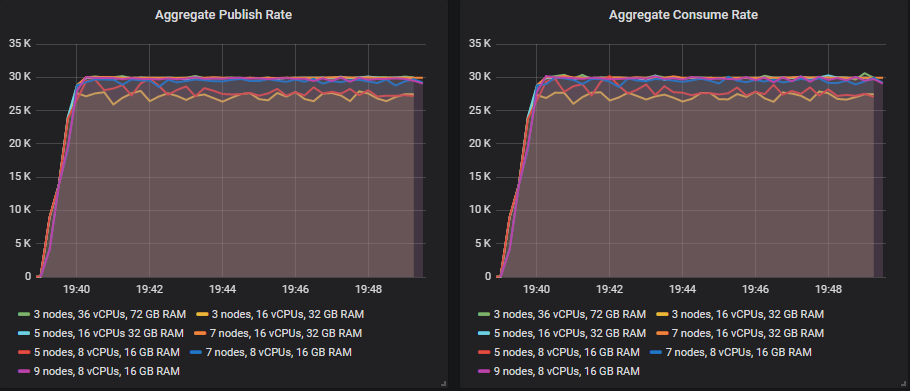
Ideal Conditions - Growing Intensity Tests
In a previous post we discussed options for running benchmarks. You can run this workload, at these intensities with the following command:
bin/runjava com.rabbitmq.perf.PerfTest \
-H amqp://guest:guest@10.0.0.1:5672/%2f,amqp://guest:guest@10.0.0.2:5672/%2f,amqp://guest:guest@10.0.0.3:5672/%2f \
-z 1800 \
-f persistent \
-q 1000 \
-c 1000 \
-ct -1 \
-ad false \
--rate 50 \
--size 1024 \
--queue-pattern 'perf-test-%d' \
--queue-pattern-from 1 \
--queue-pattern-to 100 \
-qa auto-delete=false,durable=false,x-queue-type=quorum \
--producers 200 \
--consumers 200 \
--consumer-latency 10000 \
--producer-random-start-delay 30
Just change the --rate argument to the rate you need for each test and remember that it is the rate per publisher rather than the total combined rate. Because the consumer processing time (consumer latency) is set to 10ms, we also need to increase the number of consumers for the higher publish rates.
Note that we set durable=false because this property is not relevant to quorum queues.
io1 - High Performance SSD
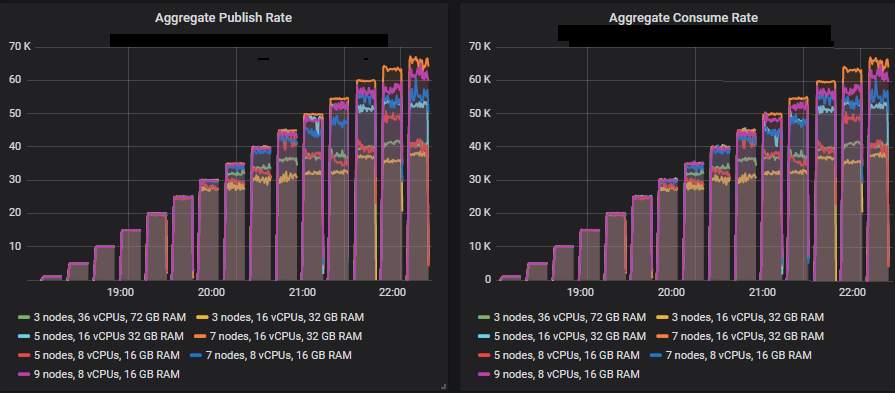
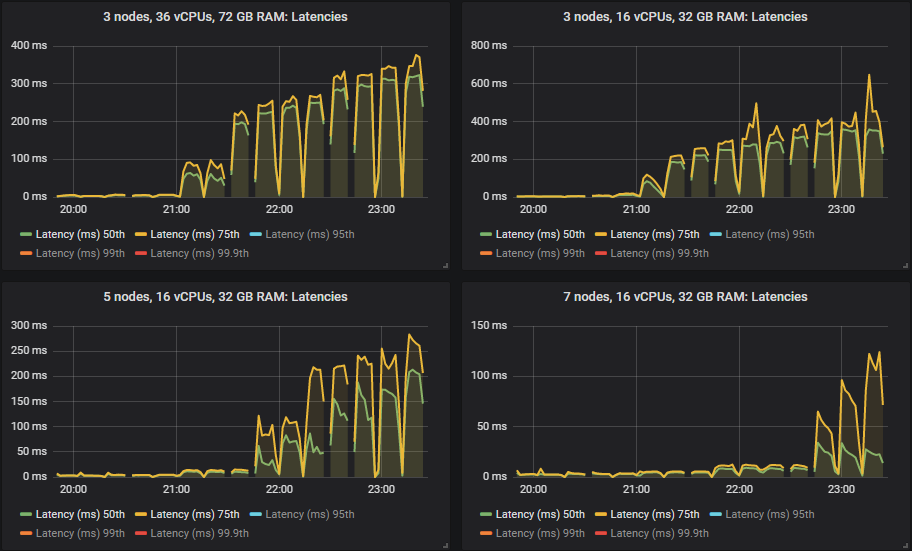
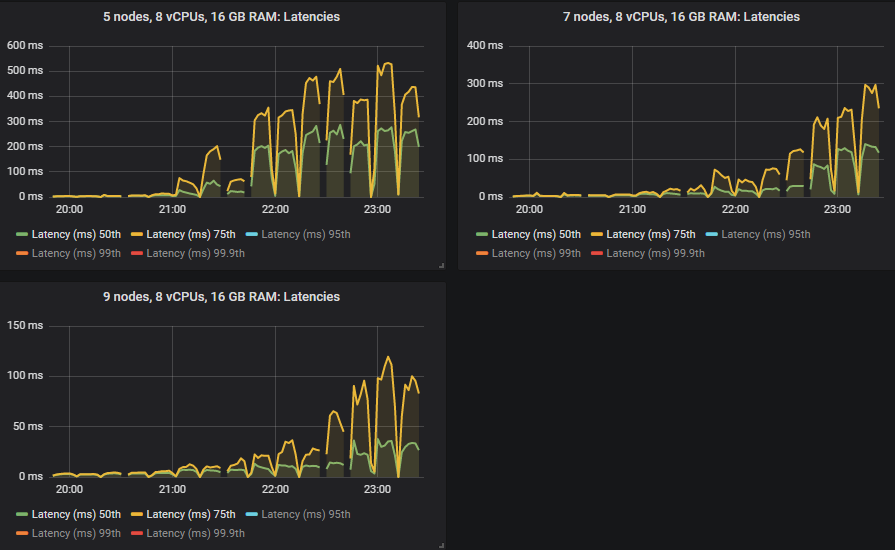
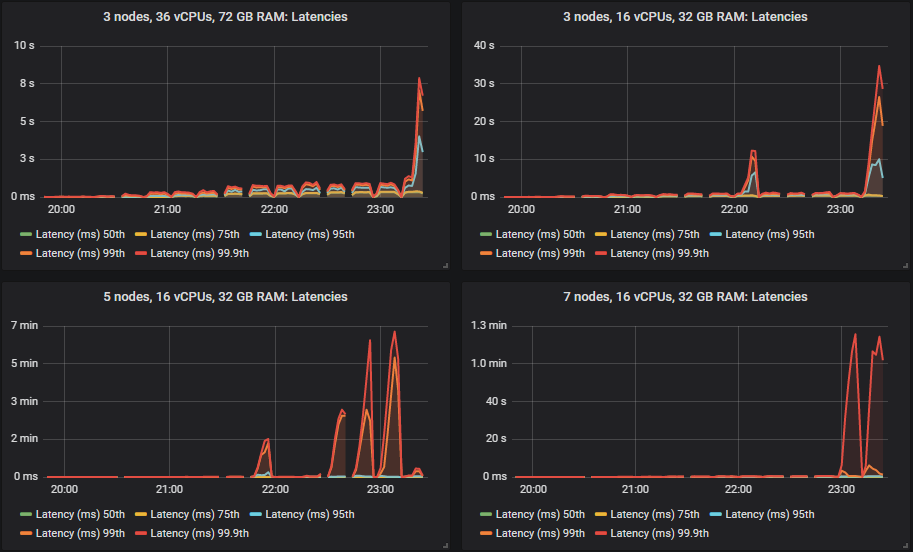
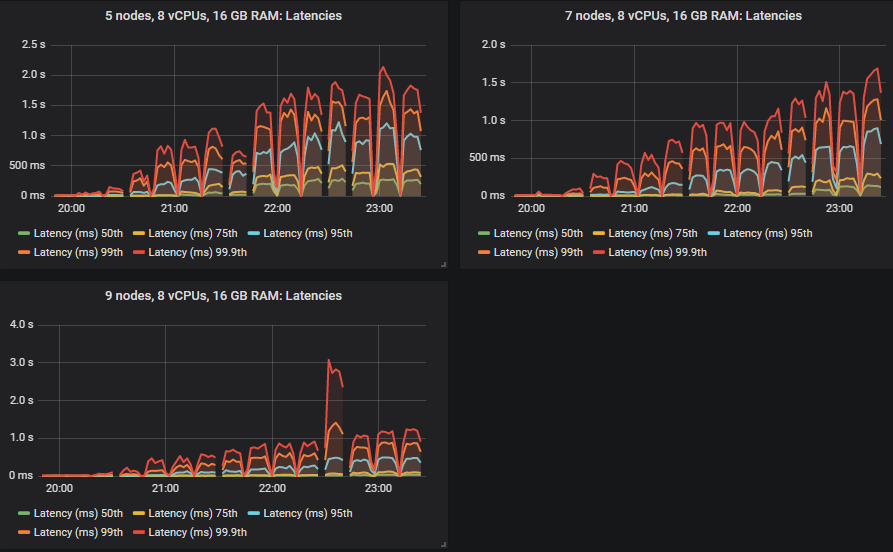
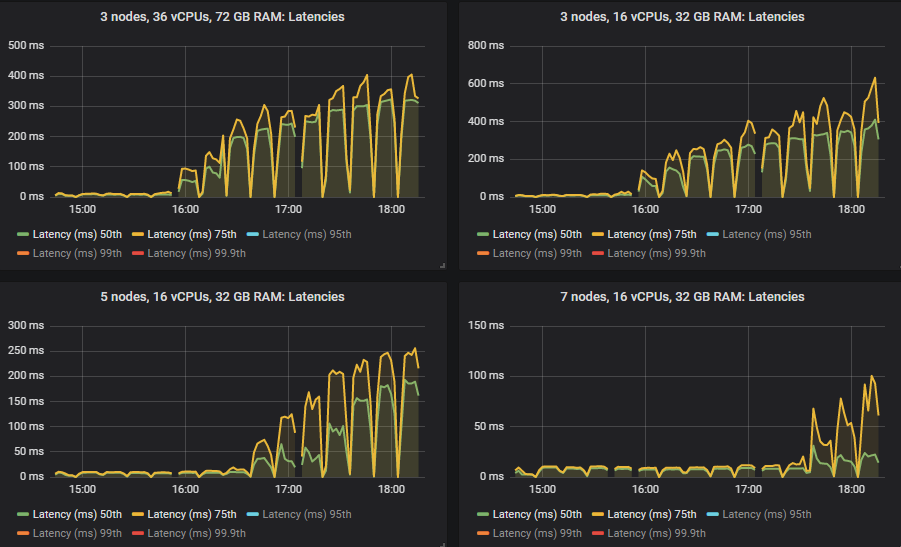
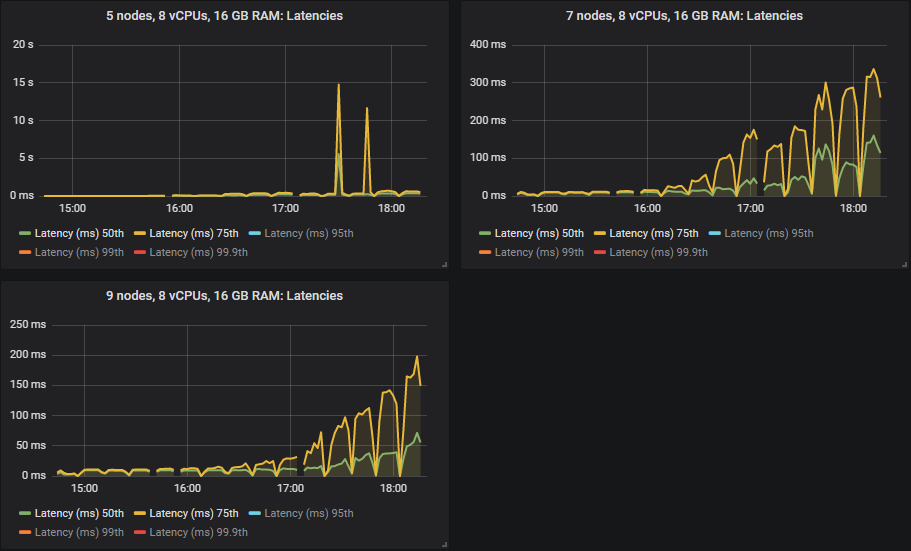
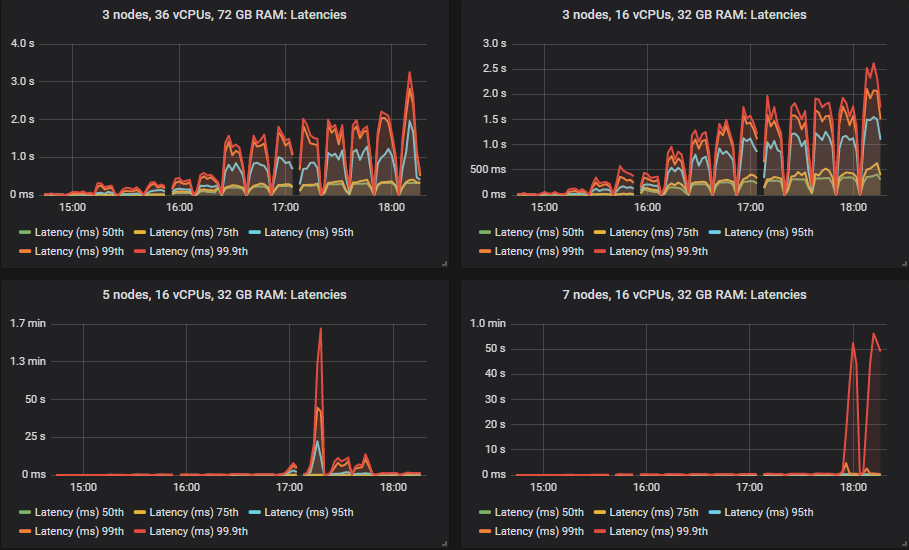
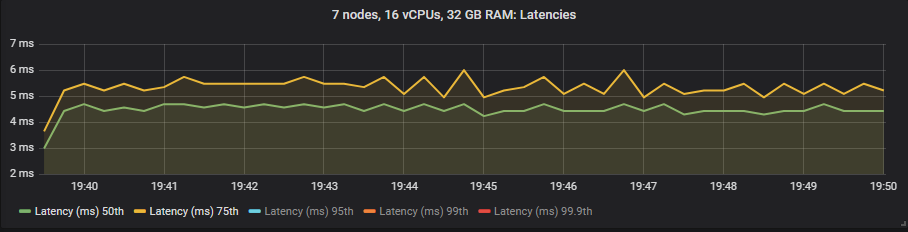
In the intensities where the quorum queues reached their limit, they tended to accumulate message backlogs, causing 95th percentile and above end-to-end latencies to go up. Below are the 50th and 75th latencies.
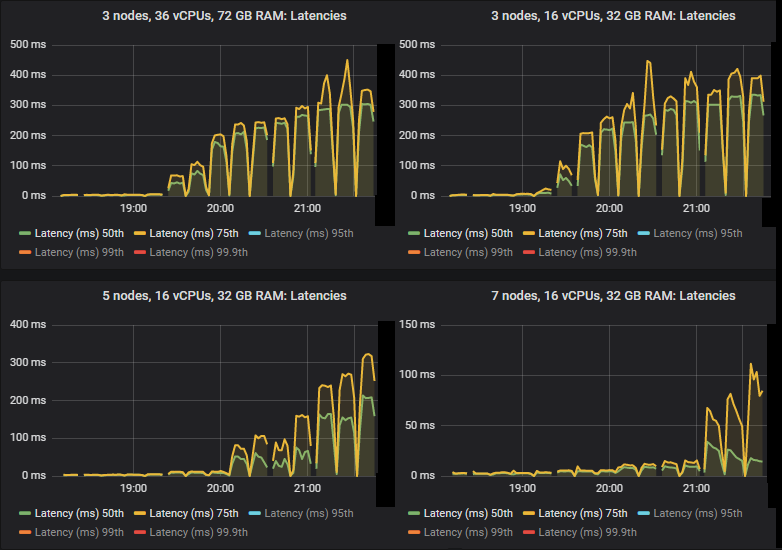
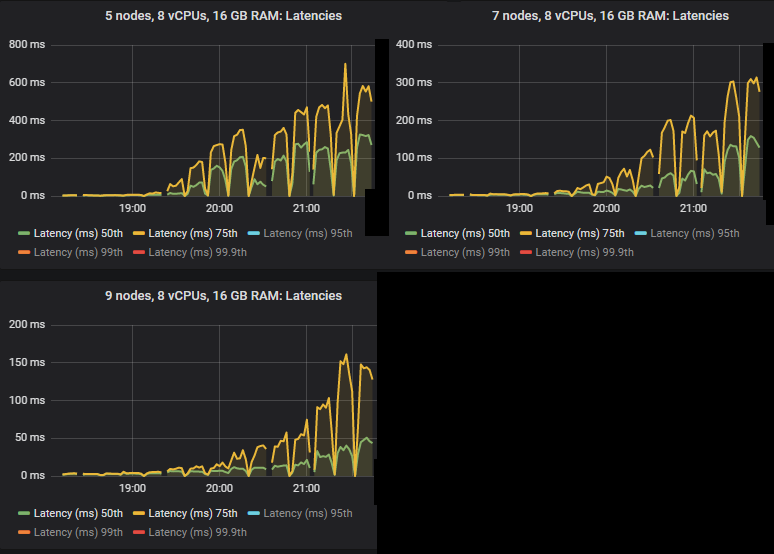
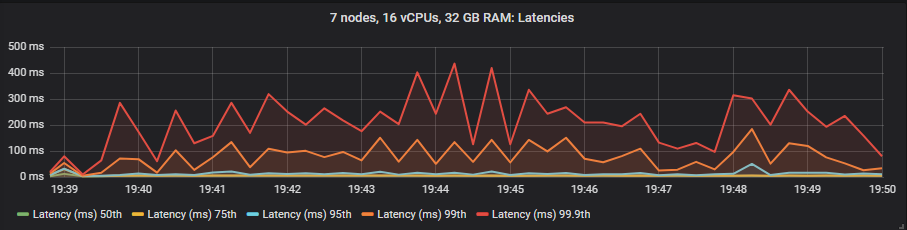
We see that in some cases latencies shot much higher when the quorum queues reached throughput capacity.
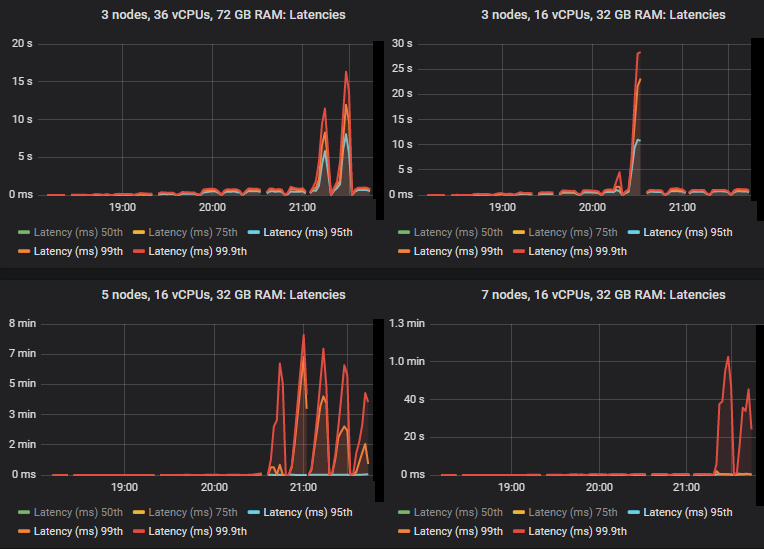
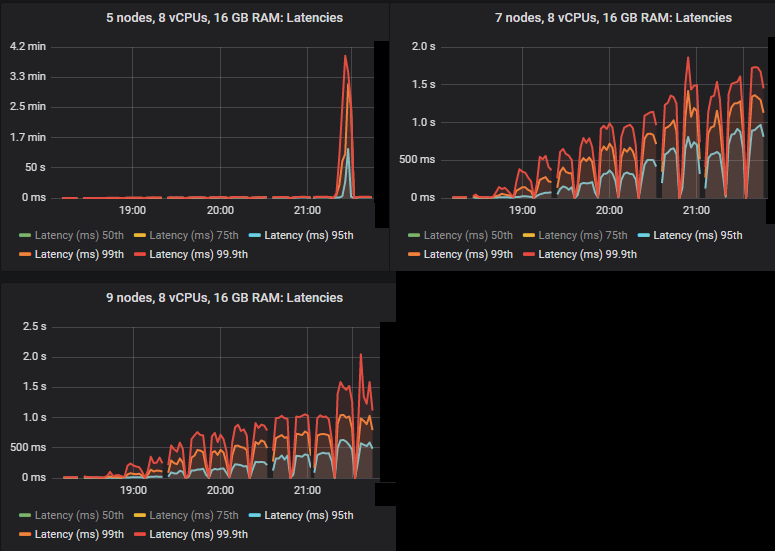
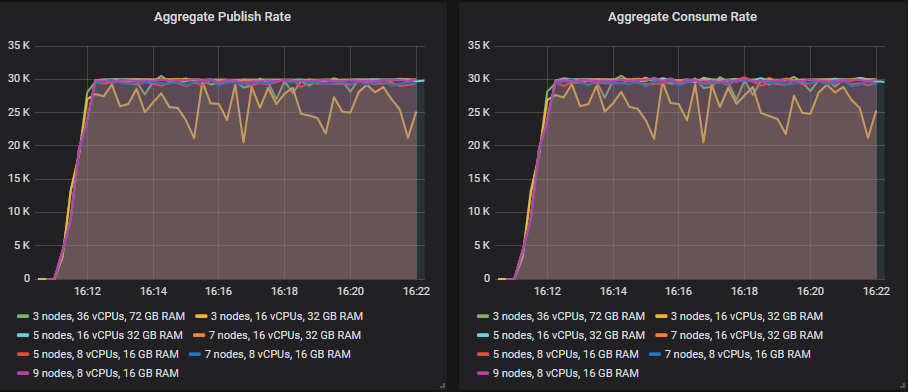
All except for the 3x16 and 5x8 clusters managed the target peak of 30k msg/s and all at below the 1 second end-to-end latency requirement. As expected, the larger clusters achieved the highest throughput.
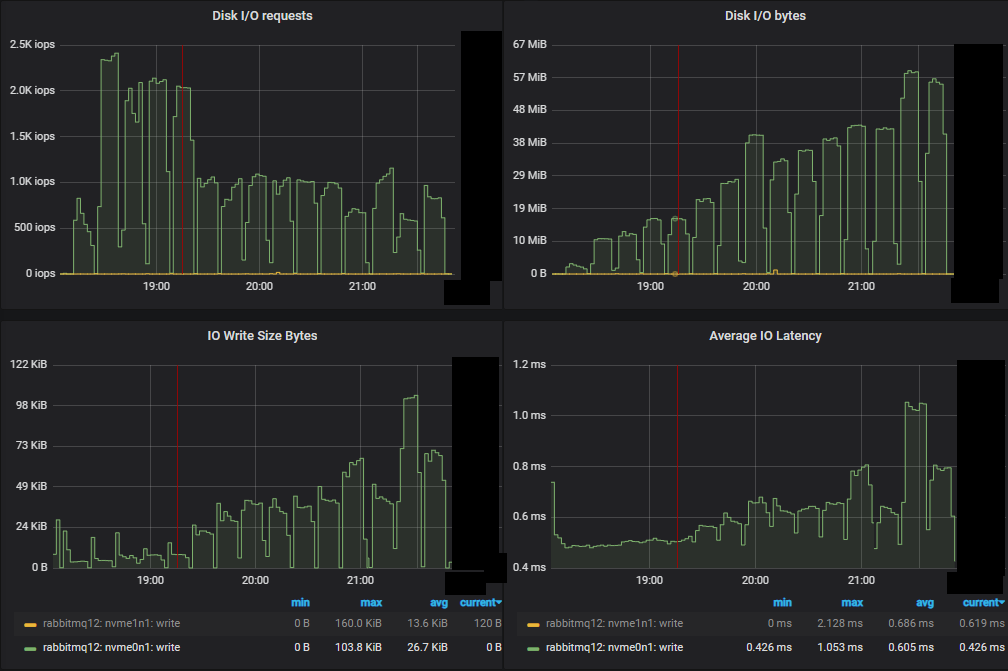
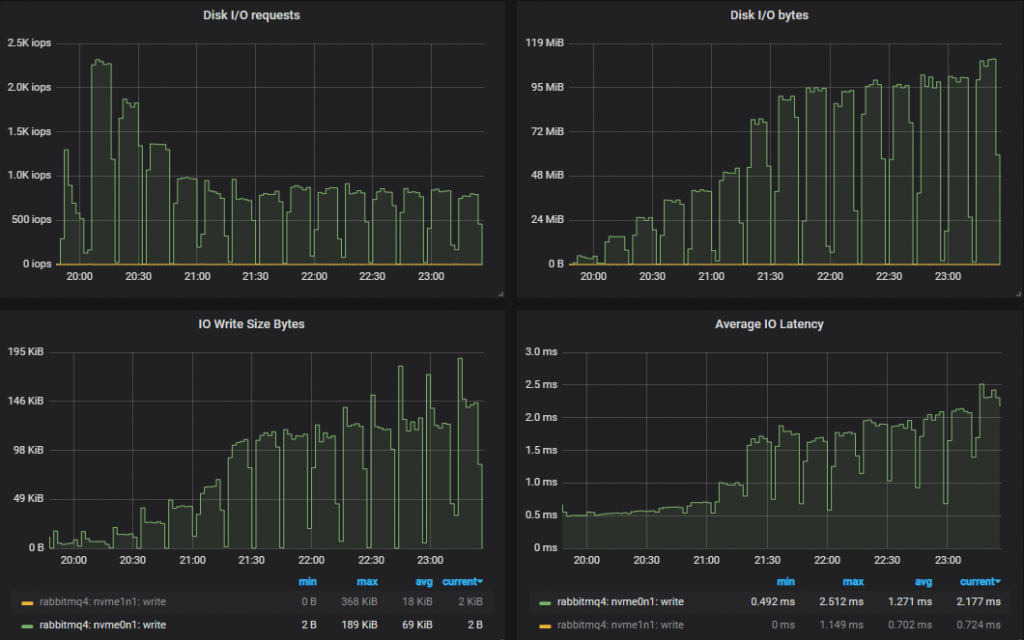
Bottom throughput cluster (3x16) server metrics
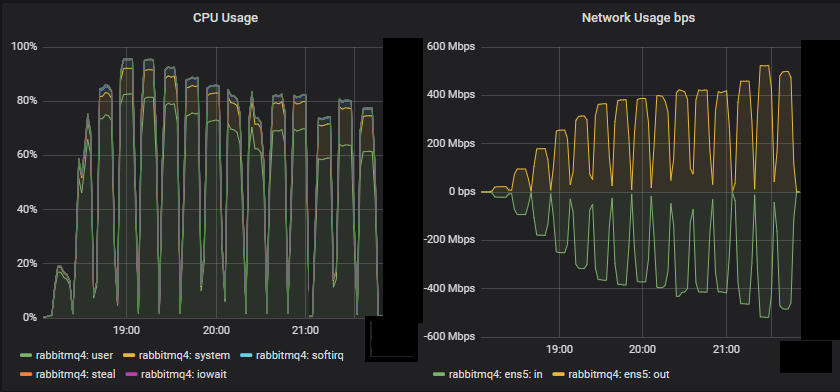
We see that for this small cluster, CPU seemed to be the resource bottleneck.
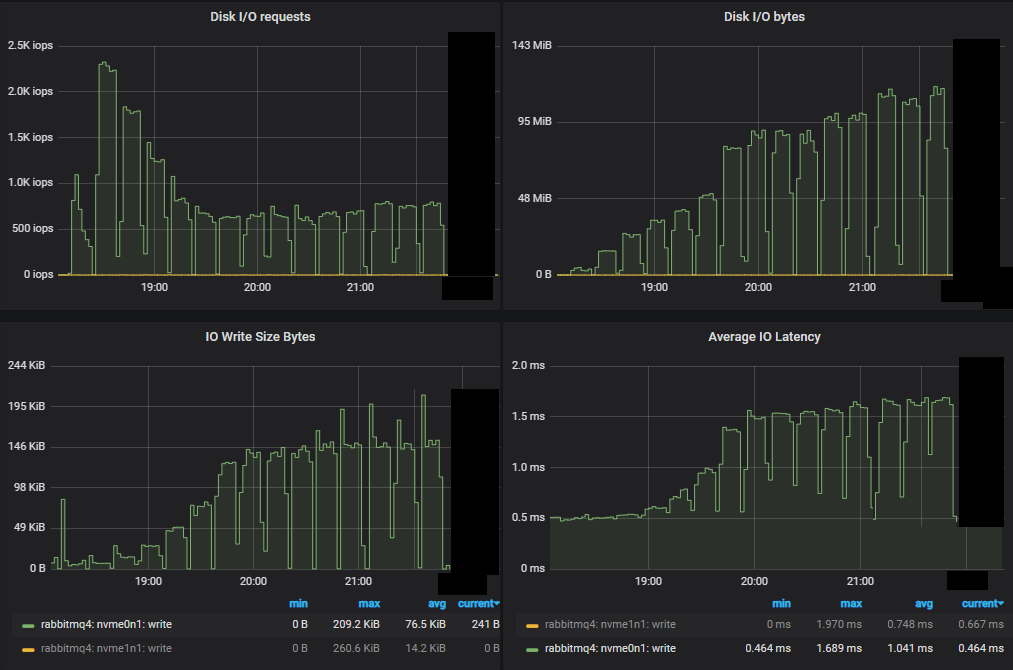
First of all we see a much lower number of IOPs compared to mirrored queues. As we progressed through the increasing intensities, the IOPs actually dropped, with each write operation getting larger and larger.
Top throughput cluster server metrics
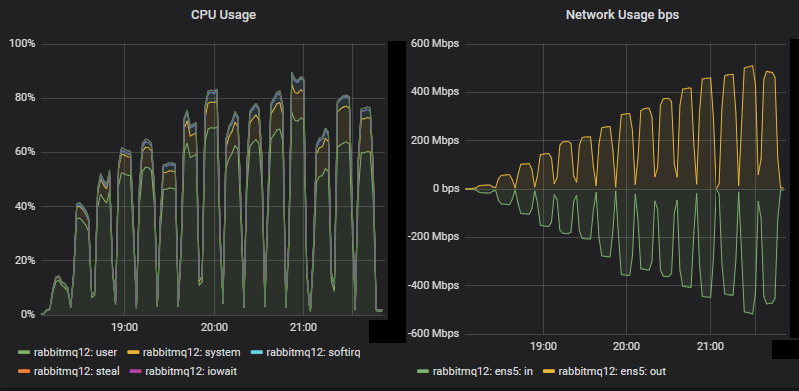
CPU did not reached saturation for this large cluster. Network bandwidth hit 500 Mbps which was lower than the same tests with mirrored queues which reached 750 Mbps (even though the mirrored queues had a lower replication factor). The inefficient usage of network by mirrored queues was discussed in a previous blog post.
Just like with the mirrored queues tests, the worst performing cluster not only managed a lower throughput, but saw higher disk IO. This is because of how quorum queues write to disk. Every message is always written to the Write-Ahead Log (WAL). In order to keep the size of the WAL under control, WAL files are truncated which involves writing their messages to segment files. There is an optimisation where if a message is consumed and acknowledged before being written to a segment file, this second disk write is not performed - as far as RabbitMQ is concerned that message no longer exists. This means that if consumers keep up, messages are only written to disk once, but if consumers fall behind then messages can end up being written to disk twice.
The top throughput cluster saw no resource bottleneck, indicating that the limitation was the cost of coordination (Raft based replication).
The bottom throughput cluster did reach above 90% CPU utilisation early on which corresponded with the moment it stopped reaching the target throughput. It reached > 90% on the 4th test and from the 5th test and onward it failed to match the target reliably.
So quorum queues will use more disk bandwidth than mirrored queues which write to disk once at most.
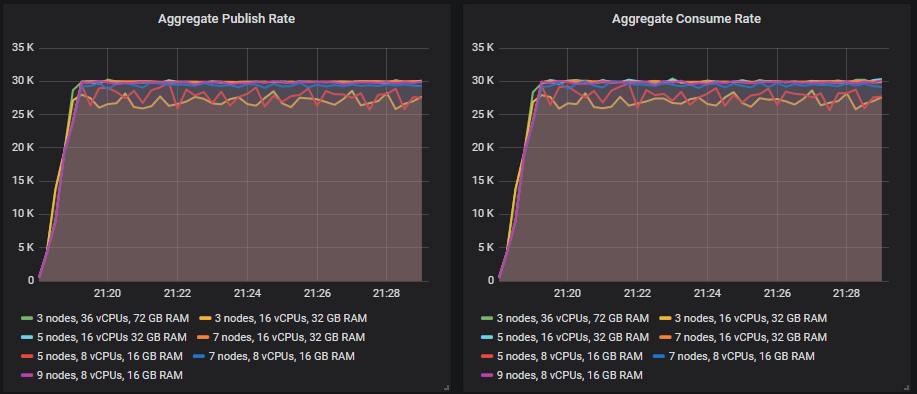
This was how each cluster coped with the target rate of 30k msg/s.
Leaderboard in matched target throughput
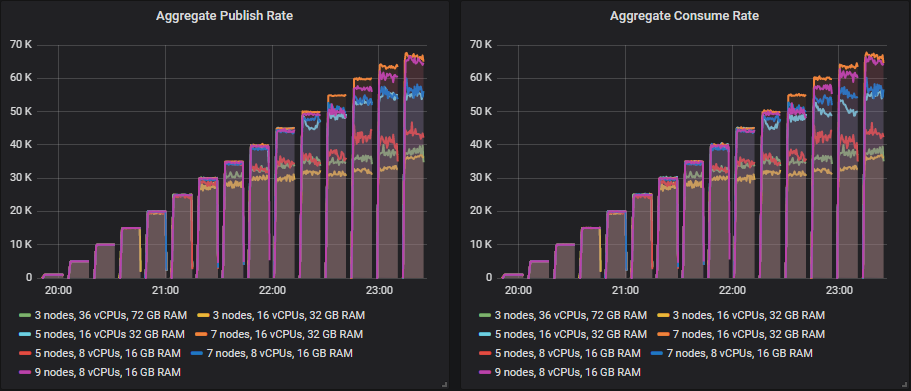
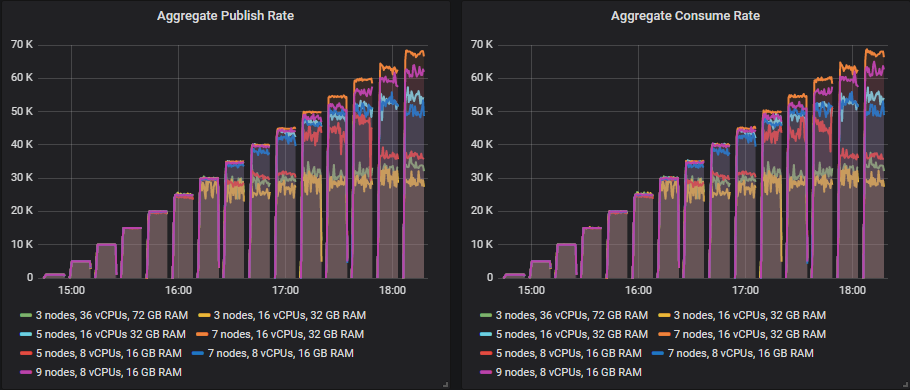
From 35k msg/s, many of the sizes continued to show increases in throughput as the target throughput increased, but always fell a little short of the target.
The one size that was able to hit its target far beyond 30k msg/s was:
- Cluster: 7 nodes, 16 vCPUs (c5.4xlarge) - 60k msg/s
The rest fell short of their targets in each test from 35k msg/s and up, but still showed higher throughput as the tests progressed. This is the leaderboard in terms of top throughput:
- Cluster: 7 nodes, 16 vCPUs (c5.4xlarge). Rate: 65k msg/s
- Cluster: 9 nodes, 8 vCPUs (c5.2xlarge). Rate: 63k msg/s
- Cluster: 7 nodes, 8 vCPUs (c5.2xlarge). Rate: 54k msg/s
- Cluster: 5 nodes, 16 vCPUs (c5.4xlarge). Rate: 53k msg/s
- Cluster: 5 nodes, 8 vCPUs (c5.2xlarge). Rate: 50k msg/s
- Cluster: 3 nodes, 36 vCPUs (c5.9xlarge). Rate: 40k msg/s
- Cluster: 3 nodes, 16 vCPUs (c5.4xlarge). Rate: 37k msg/s
Scaling out and the middle ground of up/out showed the best results.
Leaderboard in cost per 1000 messages per month, at top throughput.
- Cluster: 5 nodes, 8 vCPUs (c5.2xlarge). Cost: $97 (50k)
- Cluster: 3 nodes, 16 vCPUs (c5.4xlarge. Cost: $98 (37k)
- Cluster: 5 nodes, 16 vCPUs (c5.4xlarge. Cost: $115 (53k)
- Cluster: 7 nodes, 8 vCPUs (c5.2xlarge. Cost: $126 (54k)
- Cluster: 3 nodes, 36 vCPUs (c5.9xlarge. Cost: $137 (40k)
- Cluster: 9 nodes, 8 vCPUs (c5.2xlarge. Cost: $139 (63k)
- Cluster: 7 nodes, 16 vCPUs (c5.4xlarge. Cost: $142 (65k)
Leaderboard in cost per 1000 messages per month at a target of 30k msg/s.
We see that two clusters didn't quite manage the 30k msg/s target. The leaderboard for the ones that did:
- Cluster: 5 nodes, 16 vCPU (c5.4xlarge). Cost: $135
- Cluster: 7 nodes, 8 vCPU (c5.2xlarge). Cost: $151
- Cluster: 3 nodes, 36 vCPU (c5.9xlarge). Cost: $183
- Cluster: 9 nodes, 8 vCPU (c5.2xlarge). Cost: $194
- Cluster: 7 nodes, 16 vCPU (c5.4xlarge). Cost: $204
Cost effectiveness and performance were at odds with each other with this test. Scaling out is expensive when the storage volumes are the most costly item. The best value came from the middle ground of scaling out and up.
Do we really need those costly io1 SSDs? The IOPs in this test were relatively low and we didn’t go above 250MiB/s so the cheap gp2 volumes should be a good option. Let’s see.
gp2 - General Purpose SSD
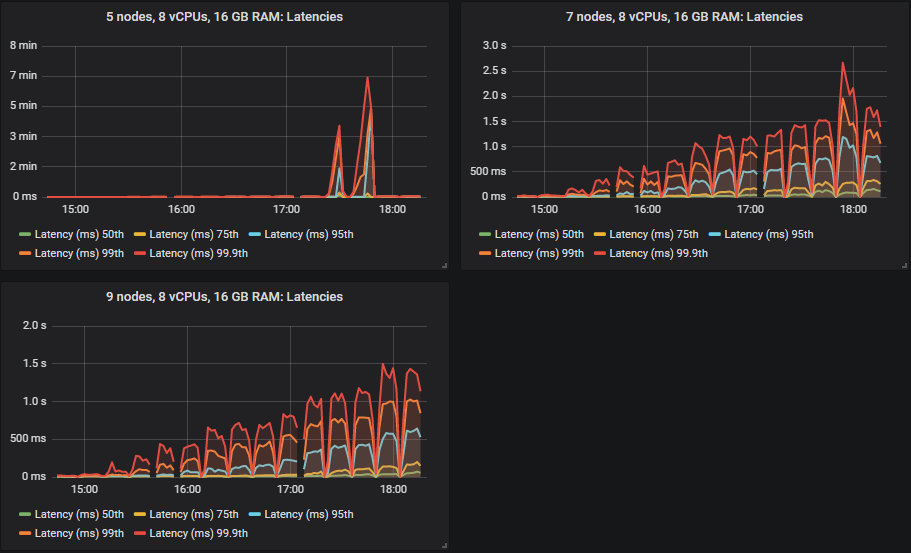
As before, the 50th and 75th percentiles remain pretty low.
But the 95th, 99th and 99.9th percentiles shot up in some cases when the clusters reached their throughput capacity. This latency basically means that queues started accumulating messages. These backlogs only occurred on the larger 16 vCPU clusters.
The results for the gp2 volumes are no worse than the more expensive io1 volumes.
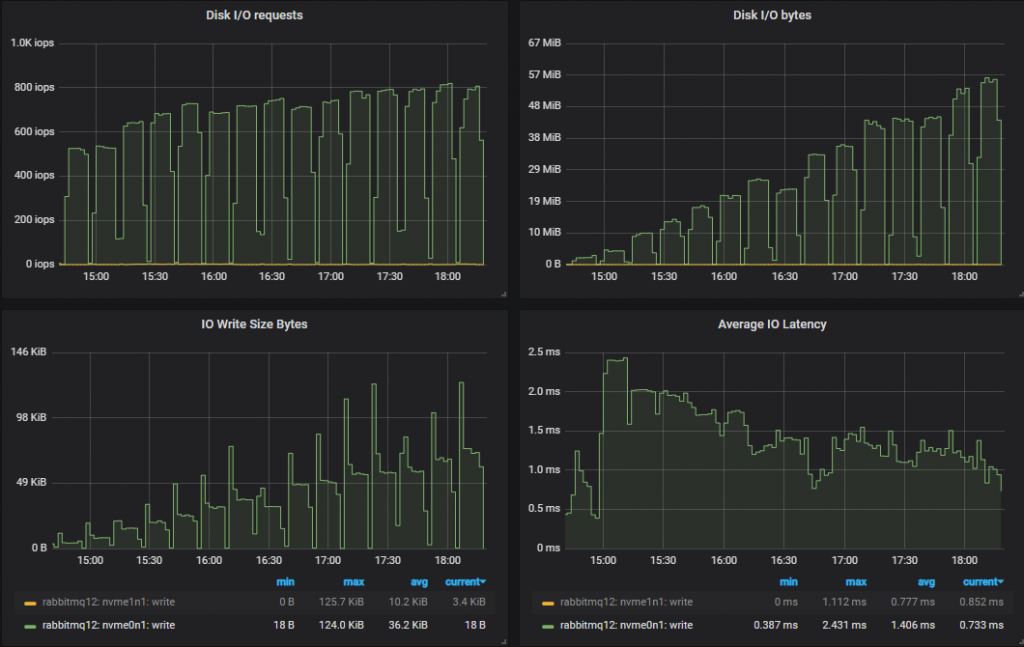
Bottom throughput cluster (3x16) disk metrics
Top throughput cluster (7x16) disk metrics.
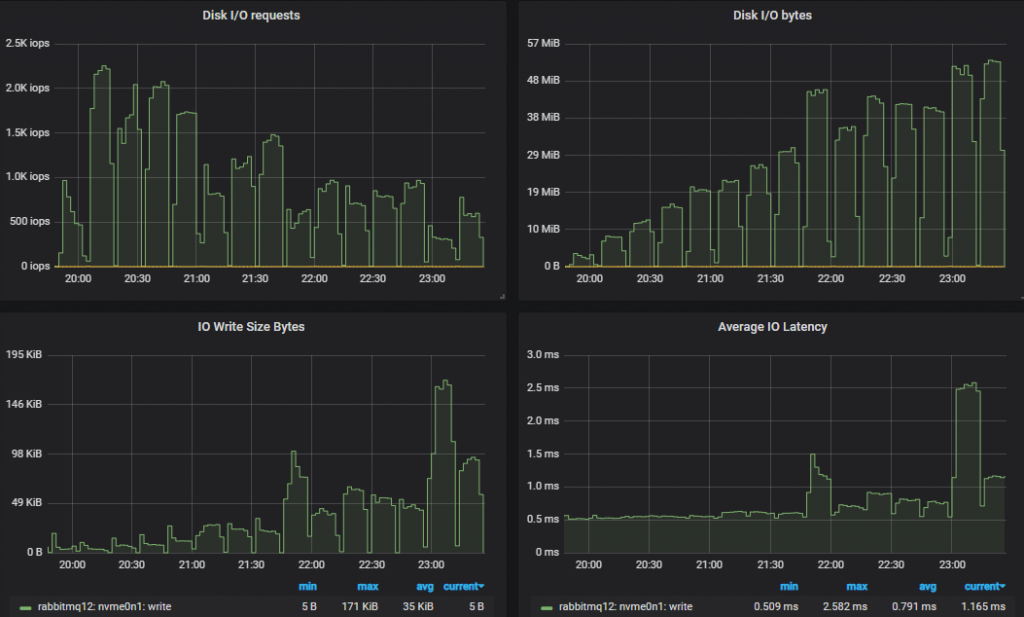
In both cases IOPs started high being relatively close to the 3000 IOPs limit (reached 2.3k) but as load increased, IO sizes grew larger and the number of operations reduced.
With a target of 30k msg/s with 1kb messages, even if we wrote every message twice, we’d still not hit the 250MiB/s limit of gp2. As before, the smaller cluster saw more disk IO because it performed more double writes than the larger, higher performing cluster.
This is how the target of 30k msg/s turned out.
Leaderboard in matched target throughput
From 35k msg/s and up, many of the sizes continued to show increases in throughput as the target throughput increased, but always fell a little short of the target.
The size that was able to hit its target far beyond that was:
- Cluster: 7 nodes, c5.4xlarge - 60k msg/s
In the tests beyond 35k msg/s the rest fell short of their targets either by just a little or by some margin, but still showed higher throughput as the tests progressed. This is the leaderboard in terms of top throughput:
- Cluster: 7 nodes, 16 vCPUs (c5.4xlarge). Rate: 67k msg/s
- Cluster: 9 nodes, 8 vCPUs (c5.2xlarge). Rate: 66k msg/s
- Cluster: 5 nodes, 16 vCPUs (c5.4xlarge). Rate: 54k msg/s
- Cluster: 7 nodes, 8 vCPUs (c5.2xlarge). Rate: 54k msg/s
- Cluster: 5 nodes, 8 vCPUs (c5.2xlarge). Rate: 42k msg/s
- Cluster: 3 nodes, 36 vCPUs (c5.9xlarge). Rate: 37k msg/s
- Cluster: 3 nodes, 16 vCPUs (c5.4xlarge). Rate: 36k msg/s
Scaling out and the middle ground of up/out showed the best results.
Leaderboard in cost per 1000 messages per month, at top throughput.
- Cluster: 5 nodes, 8 vCPUs (c5.2xlarge). Cost: $41 (42k)
- Cluster: 7 nodes, 8 vCPUs (c5.2xlarge). Cost: $45 (54k)
- Cluster: 9 nodes, 8 vCPUs (c5.2xlarge). Cost: $47 (66k)
- Cluster: 3 nodes, 16 vCPUs (c5.4xlarge). Cost: $49 (36k)
- Cluster: 5 nodes, 16 vCPUs (c5.4xlarge). Cost: $55 (54k)
- Cluster: 7 nodes, 16 vCPUs (c5.4xlarge). Cost: $72 (67k)
- Cluster: 3 nodes, 36 vCPUs (c5.9xlarge). Cost: $97 (37k)
Leaderboard in cost per 1000 messages per month at a target of 30k msg/s.
The clusters that managed the 30k msg/s target:
- Cluster: 7 nodes, 8 vCPUs (c5.2xlarge). Cost: $54
- Cluster: 9 nodes, 8 vCPUs (c5.2xlarge). Cost: $69
- Cluster: 5 nodes, 16 vCPUs (c5.4xlarge). Cost: $98
- Cluster: 7 nodes, 16 vCPUs (c5.4xlarge). Cost: $107
- Cluster: 3 nodes, 36 vCPUs (c5.9xlarge). Cost: $120
Cost effectiveness and performance were more aligned with this test. Small scaled out VMs showed great ROI due to their cheap storage volumes. For this workload, io1 is simply not worth it.
In a previous post we recommended the use of SSDs with quorum queues. We showed that quorum queues did fine on HDDs with a pure quorum queue workload. But when you run mixed workloads of classic queues and quorum queues we saw that HDDs couldn’t deliver the performance that quorum queues need. Seeing as this is a purely quorum workload, let’s see how they do on a HDD.
st1 - HDD
Quorum queues did fine on a HDD although the throughput was more choppy once a cluster had reached its throughput capacity. Throughput was also a little lower for all clusters except for the 7x16 cluster which reliably comes in at the top in these tests. We generally recommend the usage of SSDs because performance can suffer significantly with mixed classic/quorum queue workloads due to the random IO characteristics of classic queues. But this test shows that for a pure quorum queue workload, that HDD can perform well.
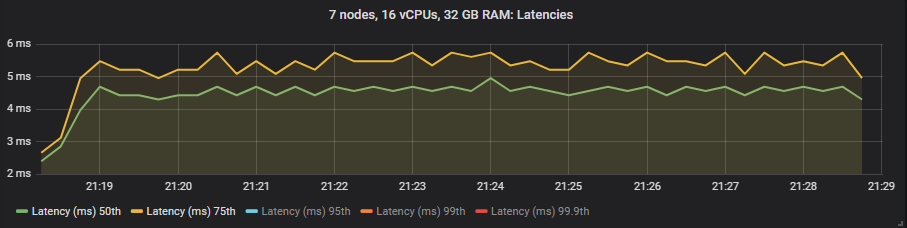
The 50th and 75th percentile latencies are higher than the SSDs though all sub-second except for the 5x8 cluster that saw message backlogs at the higher intensities.
As with the SSDs, in some cases latency shot up when clusters reached their throughput capacity (meaning that small message backlogs occurred).
Importantly, all latencies were sub-second at the 30k msg/s target.
Looking at the disk metrics, as expected for a HDD, the IOPs were generally lower again with the correspondingly large write sizes.
This is how the target of 30k msg/s turned out.
This time we could argue that the 5x8 cluster has achieved the 30k msg/s target, which it didn't manage when on SSDs.
From 35k msg/s and onward, many of the sizes continued to show increases in throughput as the target throughput increased, but fell a little short of the target.
The sizes that were able to hit their target beyond that were:
- Cluster: 7 nodes, 16 vCPUs (c5.4xlarge). Rate: 60k msg/s
- Cluster: 9 nodes, 8 vCPUs (c5.2xlarge). Rate: 40k msg/s
The rest fell short of their targets in each test beyond 35k msg/s, but still showed higher throughput as the tests progressed. This is the leaderboard in terms of top throughput:
- Cluster: 7 nodes, 16 vCPUs (c5.4xlarge). Rate: 67k msg/s
- Cluster: 9 nodes, 8 vCPUs (c5.2xlarge). Rate: 62k msg/s
- Cluster: 5 nodes, 16 vCPUs (c5.4xlarge). Rate: 54k msg/s
- Cluster: 7 nodes, 8 vCPUs (c5.2xlarge). Rate: 50k msg/s
- Cluster: 5 nodes, 8 vCPUs (c5.2xlarge). Rate: 37k msg/s
- Cluster: 3 nodes, 36 vCPUs (c5.9xlarge). Rate: 32k msg/s
- Cluster: 3 nodes, 16 vCPUs (c5.4xlarge). Rate: 27k msg/s
Scaling out and the middle ground of up/out showed the best results.
Leaderboard in cost per 1000 messages per month, at top throughput.
- Cluster: 5 nodes, 16 vCPUs (c5.4xlarge). Cost: $74 (54k)
- Cluster: 5 nodes, 8 vCPUs (c5.2xlarge). Cost: $76 (37k)
- Cluster:� 7 nodes, 8 vCPUs (c5.2xlarge). Cost: $78 (50k)
- Cluster: 9 nodes, 8 vCPUs (c5.2xlarge). Cost: $81 (62k)
- Cluster: 3 nodes, 16 vCPUs (c5.4xlarge). Cost: $89 (27k)
- Cluster: 7 nodes, 16 vCPUs (c5.4xlarge). Cost: $94 (67k)
- Cluster: 3 nodes, 36 vCPUs (c5.9xlarge). Cost: $132 (32k)
Leaderboard in cost per 1000 messages per month at a target of 30k msg/s.
- Cluster: 5 nodes, 8 vCPUs (c5.2xlarge). Cost: $93
- Cluster: 7 nodes, 8 vCPUs (c5.2xlarge). Cost: $131
- Cluster: 5 nodes, 16 vCPUs (c5.4xlarge). Cost: $134
- Cluster: 3 nodes, 36 vCPUs (c5.9xlarge). Cost: $142
- Cluster: 9 nodes, 8 vCPUs (c5.2xlarge). Cost: $168
- Cluster: 7 nodes, 16 vCPUs (c5.4xlarge). Cost: $211
Cost effectiveness and performance were not against each other in this case (like the io1) but they were not aligned either (like the gp2). Scaling out was best for performance but the more expensive volumes meant that scaling out was also now not the most cost effective. The middle ground and scaling out and up was best.
End-to-end Latency and the Three Volume Types
In these tests we treat end-to-end latency as the time between a message being published and consumed. If we look at the 30k msg/s target rate and the 7x16 cluster type we see:
io1 SSD
gp2 SSD
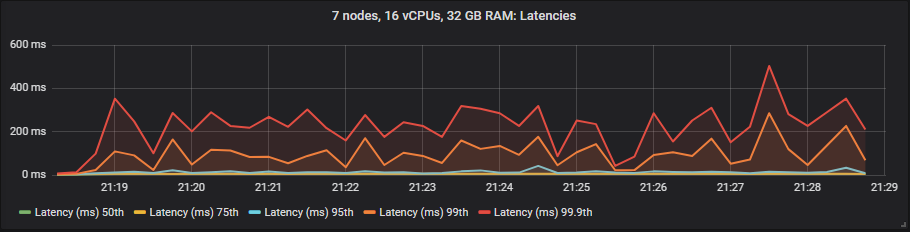
st1 HDD
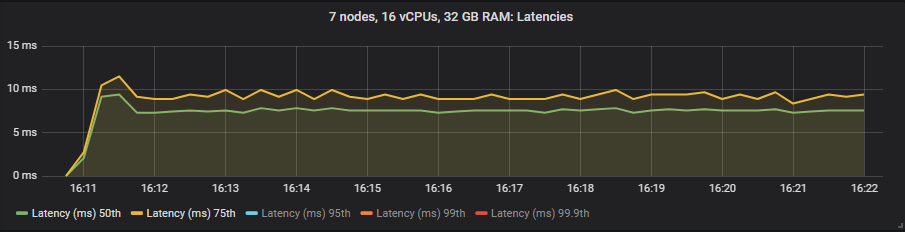
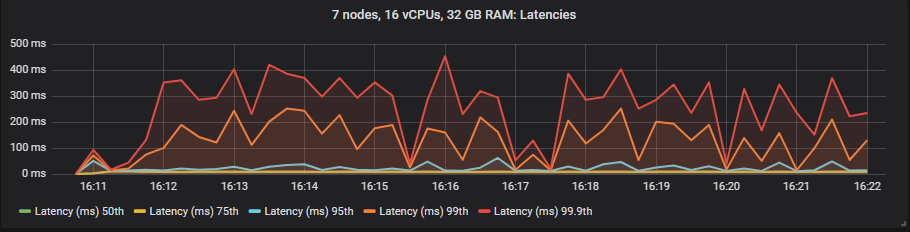
Unlike mirrored queues, we saw no benefit to latency when using the expensive io1 volumes compared to the gp2. The HDD showed higher end-to-end latencies than the SSDs as expected.
Increasing Intensity Benchmarks - Conclusion
So far the conclusions are:
- The expensive io1 volume just wasn’t worth it. It performed no better than the gp2. However, if we’d had a larger workload or larger messages we might have needed a volume capable of more than 250MiB/s, and in those cases we might choose the io1, but not with the high IOPS. With io1, you pay for the volume per GB, but also for the IOPs. So paying for 3000 (or less) instead of 10000 would make sense.
- The inexpensive gp2 volume offers the best combination of performance and cost and is the best option for most workloads. Just remember that we used a 1TB size that does not have burst IOPs and there is a 250 MiBs limit (which we never hit).
- With cheap storage volumes, scaling out the smaller 8 vCPU VMs was the most cost effective and best in terms of performance.
- With expensive volumes, going with the middle ground of scaling out and up was most cost effective.
- Scaling up with 3 large VMs was never optimal.
Top 5 Configurations for cost per 1000 msg/s per month for the 30k msg/s throughput:
- Cluster: 7 nodes, 8 vCPUs (c5.2xlarge), gp2 SDD. Cost: $54
- Cluster: 9 nodes, 8 vCPUs (c5.2xlarge), gp2 SDD. Cost: $69
- Cluster: 5 nodes, 8 vCPUs (c5.2xlarge), st1 HDD. Cost: $93
- Cluster: 5 nodes, 16 vCPUs (c5.4xlarge), gp2 SDD. Cost: $98
- Cluster: 7 nodes, 16 vCPUs (c5.4xlarge), gp2 SDD. Cost: $107
We've only tested under ideal conditions...
We've gathered a lot of data from 21 different cluster configurations at 15 different workload intensities. We think that so far we should go with a medium to large cluster of small VMs on the inexpensive gp2 volumes. But this was testing the happy scenario where queues are empty or close to empty where RabbitMQ operates at its peak performance. Next we'll run more tests that ensure that despite brokers being lost and queue backlogs occurring that our chosen cluster size continues to deliver the performance that we need. Next we test resiliency.